
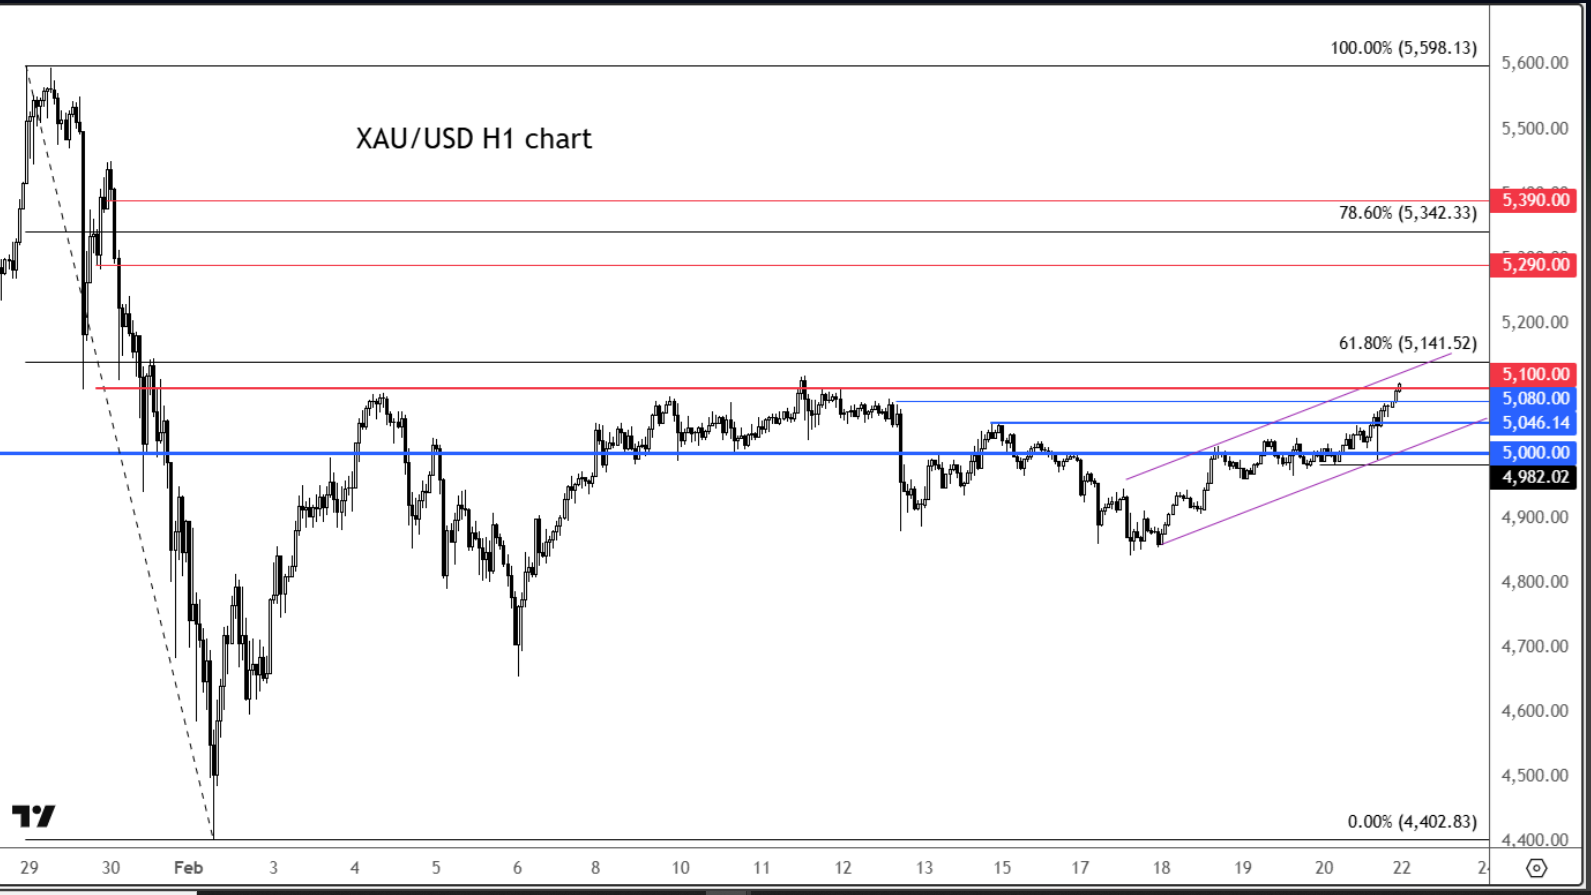
Technical Analysis of Gold - Monday, February 23, 2026
نُشر في
22 Feb 2026
تحليل السوق
daily
التوجه:
bullish

المحلل
محمد عصام
محلل مالي واقتصادي في سوق الاسهم
The trend remains bullish as long as trading stays above the 5035 – 5050 zone. Sustaining above 5080 indicates a clear strength in buying momentum.
Technical Analysis of Gold - Monday, February 23, 2026
📅 Friday's Close: 5108
🔵 Overall Trend (Daily)
The trend remains bullish as long as trading stays above the 5035 – 5050 zone. Sustaining above 5080 reflects a clear strength in buying momentum.
🟢 Positive Scenario
Sustaining above 5075 – 5085 supports the continuation of the upward movement.
🎯 Expected Targets: ✔️ 5128 ✔️ 5145 ✔️ 5170 (Extended target in case liquidity continues)
Any corrective drop towards 5075 is considered a buying re-entry.
⛔️ The bullish scenario is invalidated by a clear break below 5050.
🔴 Alternative Scenario
A break below 5050 opens the path to: 📉 5020 📉 4985
Here, the short-term trend shifts to a deeper correction.
⚡️ Hourly and 15-Minute Frame
The momentum is positive as long as the price remains above 5095. Breaking below this level would lead to a quick correction to 5075 before a potential resumption of the upward trend.
💎 Conclusion
The trend is bullish – buying with the trend is optimal. Capital management is paramount. The nearest resistance at 5128 deserves close monitoring.
📌 The market does not move randomly… but rather through liquidity and smart positioning.
كُتب بواسطة
محمد عصام
محلل مالي واقتصادي في سوق الاسهم
محمد عصام المحلل الرئيسي لمجتمع خلف الشارت